As we have seen above data that are available for modelling nitrate leaching at various scales. However, this estimate does not provide any information on the amount of nitrogen emission to surface waters as nitrate reduction processes will take place from the root zone to the surface waters.
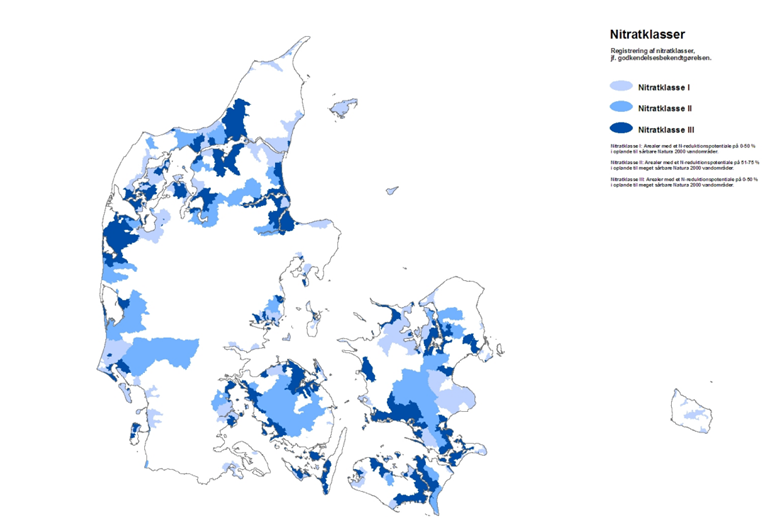
The Statutory Order on permission and authorisation of animal husbandry from 2007 prescribe an evaluation of the farm emission of nitrate to surface waters. In order to obtain such estimates, a nitrateclass map has been developed (figure 1). The map gives following information:
- For each water body shown in figure 1 the nitrate leaching was estimated for the year 1989/90, assuming that year represents the previous 10-20 years of agriculture.
The data from the Stream Monitoring programme is used for calculating the nitrogen transport to streams of the same water bodies. This estimate is based on the annual flow weighted concentrations and a water flow corrected for climatic variations.
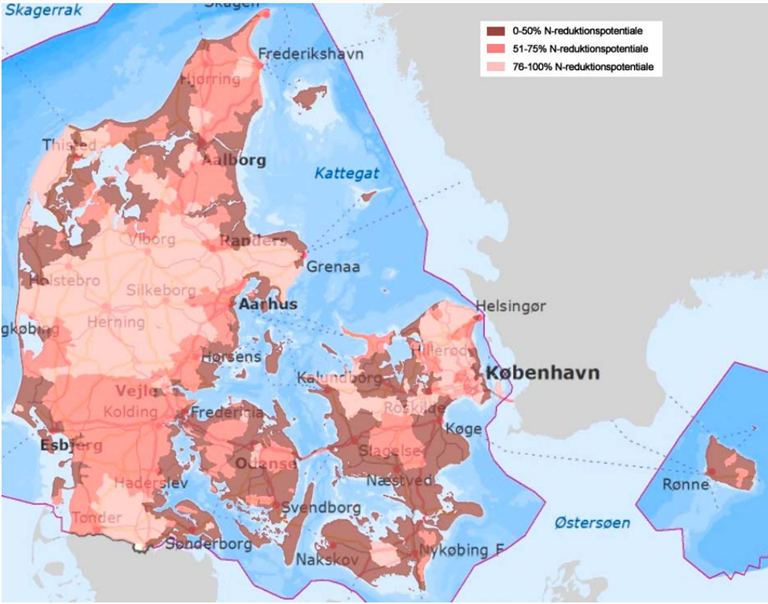
- The ratio between nitrate leaching and estimated corrected stream transport are taken as the nitrogen reduction percentage (figure 2).
In catchments with no stream measurement, model estimates were employed. The procedure is described by Windolf and Tornbjerg (2009). These are of course very rough estimates.
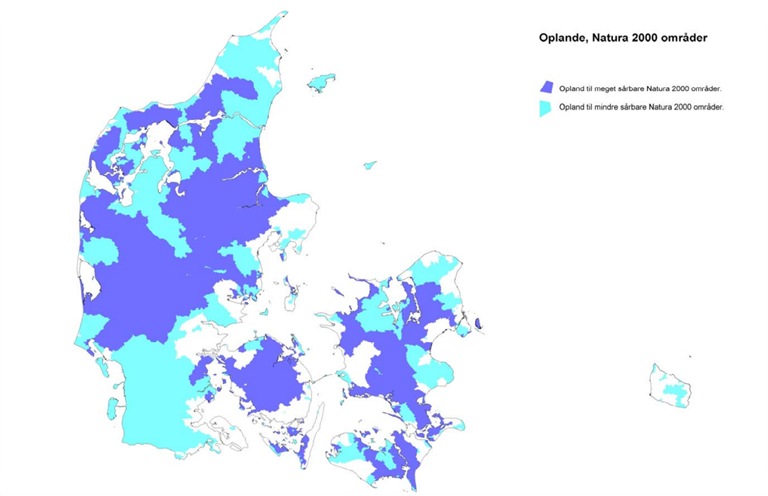
All Natura 2000-areas are mapped as either very nitrogen vulnerable or vulnerable. The very nitrogen vulnerable Natura 2000-areas are water bodies with low water with and with low water exchange. 85 pct. of the Danish area drain off to Natura 2000-areas (figure 3).
The map is used for identification of areas, where there will be a condition of reduction of the number of LU/ha (The harmony rules) when a livestock is approved.
Distribution within nitrate classes
| Reduction-potential for nitrogen, pct. |
Catchment area to very nitrogen vulnerable Natura 2000-areas |
Catchment area to nitrogen vulnerable Natura 2000-areas |
Catchment area to other areas |
| 0-50 |
Nitrate class III: 50% of harmony rules |
Nitrate class I: 85% of harmony rules |
Harmony rules |
| 51-75 |
Nitrate class II: 65% of harmony rules |
Harmony rules |
Harmony rules |
| 76-100 |
Harmony rules |
Harmony rules |
Harmony rules |
Nitrate class map

Figure 1. Nitrate class map
Nitrogen reduction map of Denmark

Figure 2. Nitrogen reduction map of Denmark
Natura 2000-areas

Figure 3. Natura 2000-areas which are very nitrogen vulnerable (dark blue) or vulnerable (bright)
More maps
See more maps at Danmarks Miljøportal (in Danish)